World's First Web-Based Feature Selective Validation (FSV) Tool
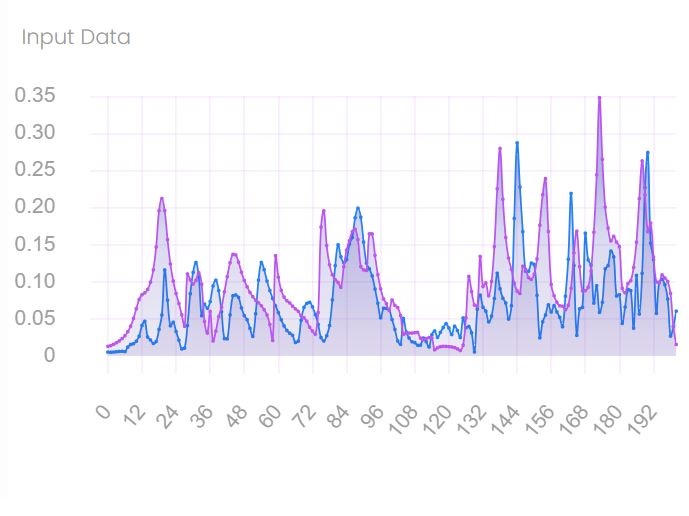
Reading and Pre-processing the Two Datasets to be Compared
The two input datasets may
- Contain different numbers of data points,
- Exist over different ranges of the common independent variable, and
- Have either coincident or noncoincident values of the common independent variable.
The two input datasets are manupulated to generate the working datasets used in the calculation of the amplitude difference measure (ADM) and feature difference measure (FDM).
The working datasets contain the same number of data points and have coincident values of the common independent variable.
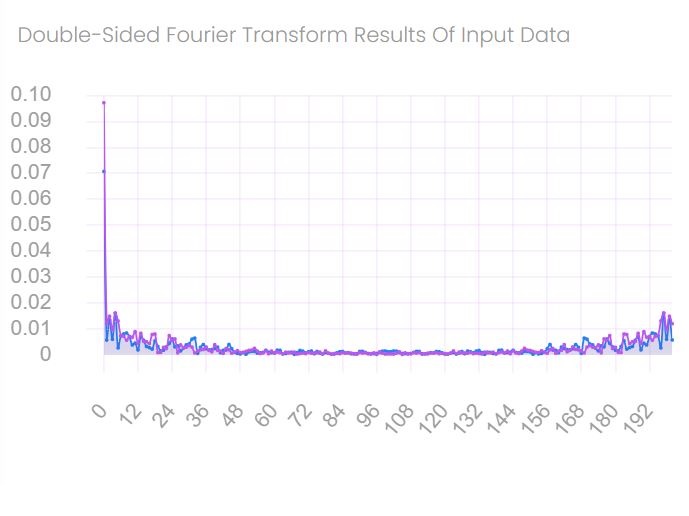
Performing DFT and Calculating 'DC', 'LOW', and 'HIGH' Datasets
The discrete Fourier transform (DFT) is performed with both working datasets. The transformed datasets are then divided into three separate vectors: DC, LOW, and HIGH. The DC vectors contain the first four data points within the Fourier transformed datasets. The boundary location between LOW and HIGH vectors is determined as lowest of the two data point from the two datasets at which the sum of the magnitude values of the independent variable starting from the fifth point is greater than or equal to 40% of the total sum of the independent variable. On the filtered vectors, the inverse DFT is performed.
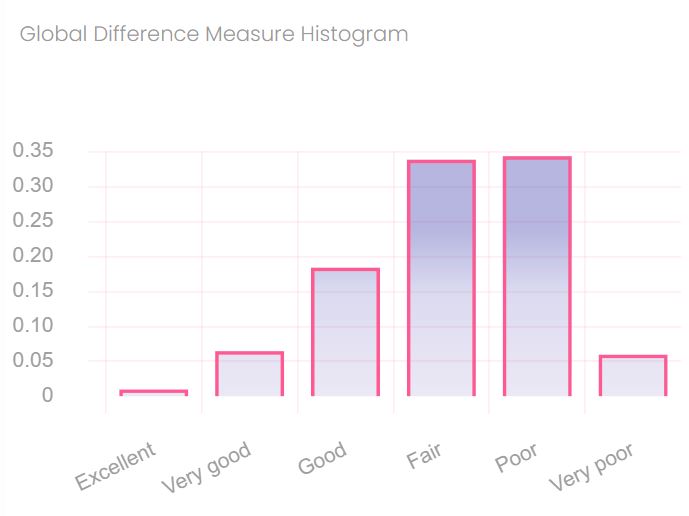
Evaluating Point-by-Point and Mean Values of ADM, FDM, and GDM
First, ADM is calculated using the filtered datasets (DC and LOW) of the two input datasets on a point-by-point basis. Second, point-by-point FDM values are calculated with the first derivates of the LOW and HI datasets and the second derivatives of the HIGH datasets. The derivatives accentuate the high rate-of-change features in the datasets. Third, the Global Difference Measure (GDM) is obtained with the ADM and FDM being largely independent. Next, the ADM, FDM and GDM histograms are obtained with six categories: excellent, very good, good, fair, poor, and very poor. Lastly, the mean values of xDM are calculated.
Mean Square Error (MSE) vs. Feature Selective Validation (FSV)
1. Definition:
- Mean Square Error (MSE): It is a measure used to quantify the difference between the true values and the predicted values. It is calculated as the average of the squared differences between the true and predicted values.
\[ \text{MSE} = \frac{1}{n} \sum_{i=1}^{n} (y_i - \hat{y}_i)^2 \]
Where \(y_i\) is the actual value and \(\hat{y}_i\) is the predicted value.
- Feature Selective Validation (FSV): FSV is a more specialized metric mainly used in the context of comparing numerical data sets, such as results from electromagnetic simulations versus measured data. It tries to identify differences in features rather than purely looking at the raw difference in numerical values.
Discover more
Symmetric Mean Absolute Percentage Error (sMAPE) vs. Feature Selective Validation (FSV)
Symmetric Mean Absolute Percentage Error (sMAPE) and Feature Selective Validation (FSV) are two different methods for evaluating the accuracy of a simulation model compared to measurement results.
Discover more